
Creating an Area-Capacity Curve from TIN Surfaces
The Area Capacity Curve tool generates a curve that illustrates the relationship between surface area and capacity on a TIN surface. Moreover, this curve is essential for understanding capacity distribution within a defined region. Therefore, to create the curve, follow these steps:

- Selection of Tool
Begin by clicking ‘AVC’ from the Topography panel or typing AVC_SP in the command line. This action opens the dialogue box needed for creating the area-capacity curve. - Select the TIN
If your drawing contains multiple TIN surfaces, you should first select the TIN for which you want to create the area-capacity curve. Then, the maximum and minimum elevation values of the selected TIN will be displayed. Therefore, ensure you choose the correct TIN to accurately reflect the desired data.
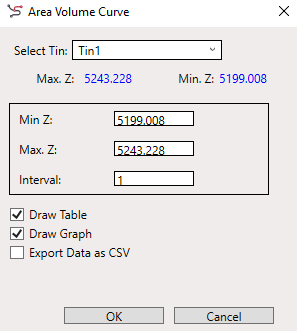
- Define Elevation Ranges
First, specify the minimum and maximum elevation values for which you need to extract the area-capacity curve. Additionally, be sure that these values do not exceed the calculated minimum and maximum elevations of the selected TIN. Accurate elevation input is essential to ensure a valid and useful curve. - Set Interval
Enter an interval for the elevation range. The interval should be a positive number, such as 1, 2, or 3, and cannot be zero. This interval determines the granularity of the area-capacity calculation. - Select Output Options
To proceed with the tool, you must select at least one option from the following: draw a table, draw a graph, or export data to CSV. These options determine how the results will be presented. Make sure to check the appropriate boxes before moving forward. - Confirm and Specify Location
Click ‘OK’ to run the tool. Next, specify the point in your drawing where you want to display the graph and table. This step ensures you position the results correctly within your CAD environment.
By following these steps, you effectively generate an area-capacity curve that visually represents the distribution of capacity within your TIN surface, aiding in detailed spatial analysis.