Purpose and Utility
The Cartographic Grid tool helps you add map reference frameworks directly to your CAD drawing. It is essential for map layout, field referencing, and publication-quality outputs where coordinate grids, reference indexes, or geographic graticules must be visually and accurately overlaid.
SPCAD offers three grid types to match your cartographic and technical needs:
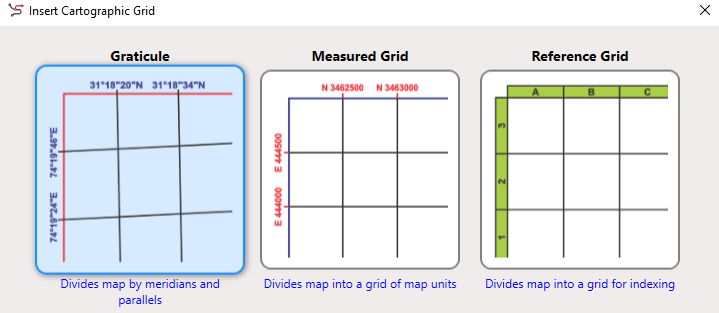
- Graticule Grid: Displays latitude and longitude lines (meridians and parallels). Ideal for global and geographic mapping.
- Measured Grid: Draws a grid based on projected coordinate values (e.g., Easting/Northing in meters). Suitable for UTM-based and engineering layouts.
- Reference Grid: Adds alphanumeric labels (e.g., A1, B2, C3) for quick referencing in map books or navigation charts.
This tool is widely used in GIS, surveying, civil engineering, and map publishing workflows.
Note: To use this tool effectively, ensure your drawing has a valid projected coordinate system assigned.
Technical Description
1- Graticule Grid:
The Graticule Grid overlays your drawing with lines of latitude (parallels) and longitude (meridians). This is especially useful when working with geographic coordinate systems (e.g., WGS84) and creating maps for global or regional visualization.
Features & Options
- Grid Appearance
Choose how the grid looks:- Labels only: Displays coordinate labels without grid lines.
- Tick marks and labels: Places ticks with values at edges.
- Grid and labels: Full grid with labeled lines (ideal for printable maps).
- Intervals
Define the frequency of lines:- Parallels (Latitude): Place horizontal lines every set interval (e.g., every 10′ or 1°).
- Meridians (Longitude): Place vertical lines based on defined spacing.
- Settings
Customize the label formatting:- Prefixes like E, N (Easting/Northing) can be adjusted.
- Suffix fields can be used for notation (e.g., ° or directional indicators).
- Set text height and precision (decimal places) to suit map scale.
- Border Option
Tick the “Place a border outside the grid” checkbox to draw a neat frame around the grid area — great for layout visuals.

2-Measured Grid
The Measured Grid divides your drawing into a rectangular mesh based on actual map units — such as meters or feet — making it ideal for engineering drawings, topographic maps, and spatial plans where real-world distances matter.
Features & Options:
- Grid Appearance
Choose how the grid appears:- Labels only: Show only the coordinates at the grid lines.
- Tick marks and labels: Add tick lines and numeric values.
- Grid and labels: Display full rectangular mesh with coordinates for both axes.
- Intervals
Define spacing for your grid lines:- X Axis (Easting): e.g., every 10 meters — great for regular spacing across horizontal extent.
- Y Axis (Northing): e.g., every 10 meters — helpful in sectioning vertical layout.
- Settings
Customize labeling:- Prefix and suffix options for both Easting and Northing labels.
- Control text height for readability and precision for decimal rounding.
- Border Option
Enable “Place a border outside the grid” to enclose your map for presentation or printing.

3- Reference Grid
The Reference Grid divides your map into indexable blocks, making it easier to locate areas quickly using column-row references — much like a street map atlas or city directory. It’s particularly useful for printed map sheets, atlases, and field navigation tools.
Features & Options:
- Grid Appearance
- Index tabs only: Show just the index labels (e.g., A, B, C…).
- Grid and index tabs: Display both the rectangular grid and tab labels.
- Intervals
Define the number of columns and rows to divide your map area into (e.g., 4×4 grid). - Tab Configuration
Choose how the indexing system is structured:- A, B, C… in columns; 1, 2, 3… in rows (Column first — common in atlases).
- A, B, C… in rows; 1, 2, 3… in columns (Row first — alternate indexing style).
- Border Option
A surrounding border can be added for cleaner print layouts or digital exports.

Workflow
- Assign a projected coordinate system to your drawing before launching the tool. The grid relies on coordinate system values to display meaningful locations.
- Launch the tool using the CGRID_SP command or from the Map Elements dropdown in the Cartography tab in the ribbon.
- Select a grid type: Graticule, Measured, or Reference.
- Configure settings such as interval spacing, text height, precision, and coordinate prefixes/suffixes.
- Click OK to insert the selected grid into your drawing window.
- To modify a grid after placement, simply double-click on the grid.
The settings dialog will reopen, allowing easy adjustments. - Adjust placement, layer properties, or styling for optimal visual presentation as needed.
Output Examples
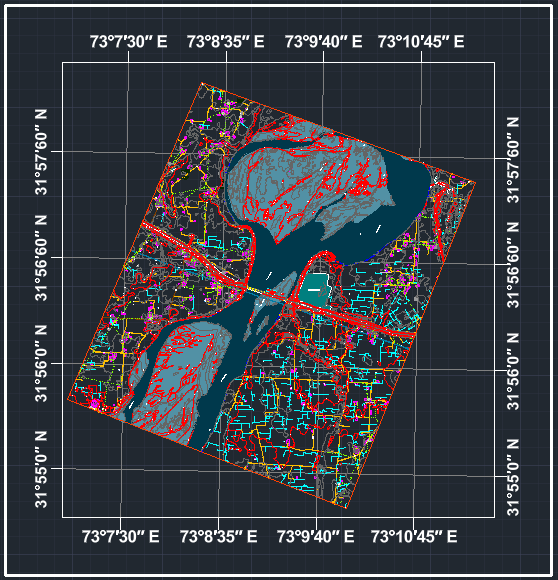
- Graticule Grid: Shows labels like 31°18’20″N, 74°19’55″E
- Measured Grid: Places 10m x 10m lines with E 521000, N 3940000 labels

- Reference Grid: Displays grid boxes with A1, A2, B1, B2-style indexing

Notes
- Assigning the correct projected coordinate system is essential for grid accuracy.
- Compatible with layout maps, map books, utility plans, and geospatial presentations.
- Can be combined with other SPCAD tools like Coordinate Labels and Map Elements for a professional layout.
Tip
You can view two grids simultaneously in your drawing.
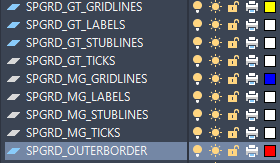
Easily manage their colors via Layers, and adjust text styles as needed for better clarity and visual distinction.