Overview
The Modify Profile tool allows you to edit the appearance, scale, axis labels, grid lines, tabular data, and exported profile data for an existing profile view.
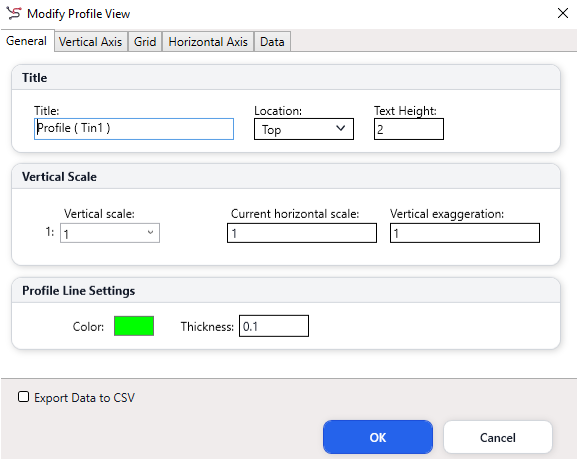
To open the dialog box, double-click an existing profile in the drawing. The Modify Profile View dialog will appear. After making changes, click OK to apply them or Cancel to close the dialog without saving changes.
General Tab
The General tab controls the main profile title, vertical scaling, and profile line appearance.
Title
Use this section to define how the profile title is displayed.
Title
Sets the title text displayed on the profile view.
Location
Controls where the title is placed, such as at the top of the profile.
Text Height
Sets the height of the title text in drawing units.
Vertical Scale
Use this section to control the vertical exaggeration of the profile.
Vertical Scale
Sets the vertical scale ratio for the profile view.
Current Horizontal Scale
Displays or defines the horizontal scale used by the profile.
Vertical Exaggeration
Controls how much the vertical profile is exaggerated compared with the horizontal scale.
A higher vertical exaggeration makes elevation changes appear more visible, which is useful for flat terrain or long profiles.
Profile Line Settings
Use this section to control the appearance of the actual profile line.
Color
Sets the display color of the profile line.
Thickness
Sets the line thickness of the profile line.
Export Data to CSV
Enable Export Data to CSV if you want to export the profile station/offset and elevation data when applying the changes.
Vertical Axis Tab
The Vertical Axis tab controls the elevation axis, including the header, tick marks, and elevation labels.
Show Header
Enable Show Header to display a header beside the vertical axis.
Header Text
Sets the header text, such as Elevation.
Text Height
Sets the text height of the vertical axis header.
Show Labels
Enable Show Labels to display elevation labels along the vertical axis.
Tick Size
Sets the length of the tick marks on the vertical axis.
Precision
Sets the number of decimal places used for elevation labels.
Label Interval
Controls the interval at which elevation labels are displayed.
Text Height
Sets the text height of the vertical axis labels.
Use this tab when you need to make the elevation axis clearer, reduce label clutter, or adjust the readability of elevation values.
Grid Tab
The Grid tab controls horizontal and vertical grid lines and the padding around the profile.
Horizontal Grid Lines
Enable Horizontal to display horizontal grid lines across the profile.
Interval
Sets the spacing between horizontal grid lines.
Clip Grid Lines
Clips horizontal grid lines to the profile view area.
Horizontal grid lines are useful for reading elevations across the profile.
Vertical Grid Lines
Enable Vertical to display vertical grid lines across the profile.
Interval
Sets the spacing between vertical grid lines.
Clip Grid Lines
Clips vertical grid lines to the profile view area.
Vertical grid lines are useful for reading distances or chainages along the profile.
Grid Padding
Grid padding controls the extra space around the profile line.
Above Maximum Elevation
Adds space above the highest elevation in the profile.
Below Datum
Adds space below the profile datum.
To Left
Adds space to the left side of the profile.
To Right
Adds space to the right side of the profile.
Use padding to prevent the profile line, labels, title, or grid from appearing too close to the profile boundary.
Horizontal Axis Tab
The Horizontal Axis tab controls the chainage or stationing shown along the bottom of the profile.
Axis Settings
Distance Format
Sets the format of the horizontal distance labels, such as 0+000.
Precision
Sets the number of decimal places used for horizontal distance labels.
Tick Size
Sets the size of the horizontal axis tick marks.
Text Height
Sets the text height of horizontal axis labels.
Interval
Sets the spacing between horizontal axis labels or ticks.
Starting Chainage
Sets the starting chainage value for the profile.
Use Starting Chainage when the profile does not begin at zero or when you need the profile to match a project stationing system.
Show Tabular Data
Enable Show Tabular Data to display station and elevation values in a table below the profile.
Distance Header Text
Sets the header text for the distance row, such as Chainage.
Elevation Header Text
Sets the header text for the elevation row, such as Elevation.
Header Text Height
Sets the text height of the table headers.
Data Row Height
Sets the row height for the tabular data.
Label Style
Controls how the profile data labels are displayed, such as at vertices only.
This tab is useful when the profile needs to be printed or submitted with chainage and elevation values shown clearly.
Data Tab
The Data tab displays the profile data used to draw the profile.
Station / Offset
Shows the station, chainage, or offset distance along the profile.
Elevation
Shows the elevation value at that station or offset.
Use this tab to review the profile values before exporting or applying changes. It is especially helpful for checking whether the profile contains the expected station and elevation points.
Common Workflow
- Double-click the profile in the drawing.
- On the General tab, adjust the title, scale, vertical exaggeration, line color, and thickness.
- On the Vertical Axis tab, configure elevation labels, tick marks, and header text.
- On the Grid tab, enable or disable grid lines and adjust grid padding.
- On the Horizontal Axis tab, configure chainage format, intervals, and tabular data.
- On the Data tab, review station and elevation values.
- Enable Export Data to CSV if profile data needs to be exported.
- Click OK to apply the changes.
Usability Tips
Use a clear profile title so the profile can be identified easily in the drawing.
Use vertical exaggeration carefully. A higher value makes small elevation changes easier to see, but it can also make slopes appear steeper than they really are.
Keep text height consistent between the title, axis headers, labels, and tabular data for a clean drawing appearance.
Use grid padding when labels or the profile line are too close to the border of the profile view.
Enable horizontal grid lines when elevation reading is important, and enable vertical grid lines when station or chainage reading is important.
Use Clip Grid Lines for a cleaner profile view, especially when grid lines extend beyond the intended profile area.
Choose a distance format that matches the project standard. For road, alignment, or chainage-based work, formats such as 0+000 are usually easier to read.
Use the Data tab to check station and elevation values before exporting the profile to CSV.
Use Cancel if you are only reviewing settings and do not want to apply any changes.