Overview
The Best Fit Polyline tool is used to generate a smooth polyline that mathematically approximates a trend through a given set of points. Using polynomial regression, the tool calculates a curve that minimizes the overall deviation from selected points—creating a “best fit” path through scattered data.
This is especially useful in engineering and surveying, where field data is noisy or uneven, but an analytical trend line is needed for modeling terrain profiles, road alignments, or channel sections.
Utility
Use the Best Fit Polyline tool for:
- Survey data smoothing (e.g., from GPS or Total Station)
- Centerline estimation for rivers, pipelines, or road axes
- As well as trend analysis across scattered point data
- In addition to cross-section profiling
- And generating design-ready geometries from raw survey input
Workflow
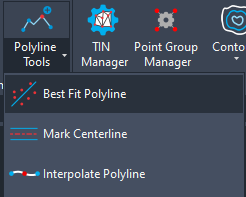
- Launch the Command: Start the Best Fit Polyline command from the SPCAD Ribbon or type the command BESTFITLINE_SP in the command line.
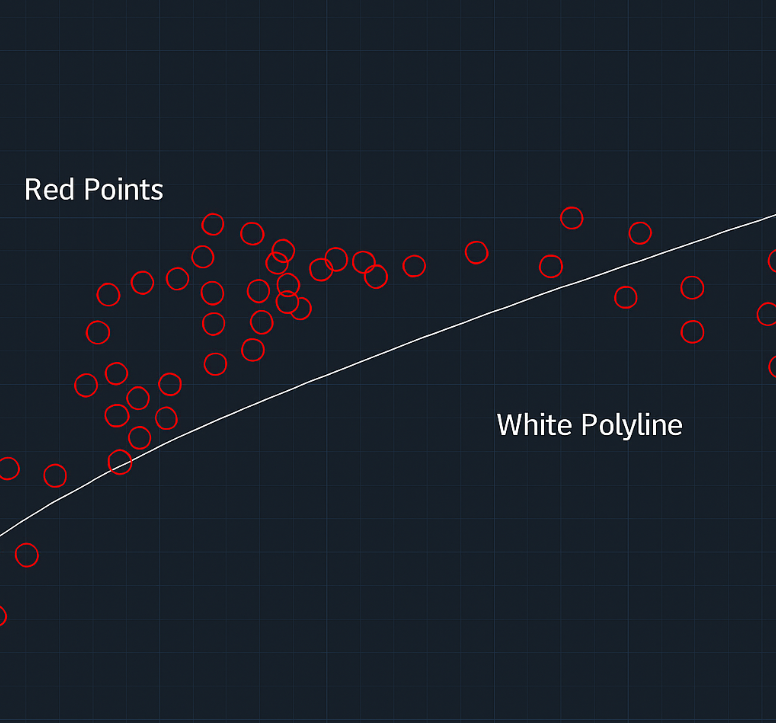
- Select Points
Click to select multiple Point objects from the drawing (e.g., red circles in the image).
- Enter Polynomial Order
Prompt will appear:- Enter order of Polynomial <1>:
Options:
- Linear (straight line)
- Quadratic (parabola)
- Cubic
- Quartic
4. Polyline Creation
A polyline is drawn that best fits the selected points based on the specified polynomial regression.
Tips
- Use ORDER = 1 for quick linear trends.
- Use higher orders (2–4) for curved or organic shapes.
- Keep order low when working with noisy or sparse data to avoid overfitting.
- Ensure points are approximately aligned in X (or Y) to avoid distortions.