Purpose and Utility
The Label Polyline With Table tool lets you annotate a closed polyline with area, perimeter, linear and angular dimensions, vertex coordinates, and a complete construction table — all with customizable precision and styling. It is highly useful for cadastral mapping, site planning, plot summaries, and technical reporting in CAD environments.
The tool ensures that both graphical labels and a data table are inserted into the drawing for clear communication of boundary information.
Technical Description
The dialog box is divided into four main groups:
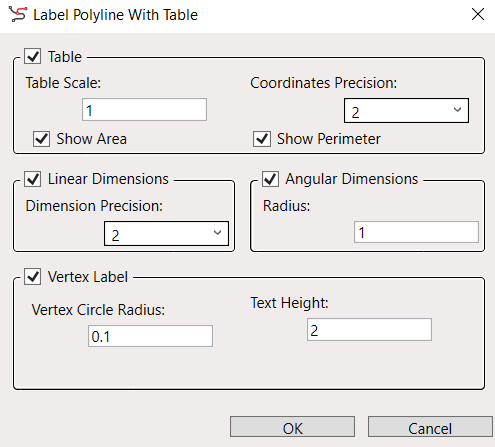
Table
- Table Scale: Controls the overall scale of the inserted table
- Coordinates Precision: Sets decimal precision for Easting/Northing
- Show Area / Show Perimeter: Displays calculated values above the table
Linear Dimensions
- Dimension Precision: Decimal precision of line lengths
- Create Linear Dimensions: Adds distance labels between vertices
Angular Dimensions
- Radius: Distance from corner to place the angle label
- Create Angular Dimensions: Adds internal angles to corners
Vertex Label
- Vertex Circle Radius: Radius of small circle drawn at each vertex
- Text Height: Size of vertex label text
Each group has a checkbox — only selected features are included in the output.
Workflow
- Launch the tool
- Type LBLUTM_SP or access it via Cartography → Labels
- Configure settings in the dialog box
- Enable the desired checkboxes: area, perimeter, dimensions, vertex labels
- Adjust scale, precision, text height, and radii as needed
- Click OK to confirm your settings
- Select a closed polyline
- The tool only supports closed loops (like plots or boundaries)
- Specify the point to place the table
- Click anywhere in the drawing to insert the summary table
Output Table Description
After selection, the tool generates a Construction Table along with area and perimeter labels. The structure of the table typically includes:
| Column | Description |
| Vertex | Labeled as P1, P2, etc. |
| Side | Represents segments (e.g., P1–P2) |
| Dist. | Distance between two points |
| Angle | Internal angles (DMS format) |
| Easting / Northing | Coordinates of each vertex |
Additional information (above the table):
- Area in square meters (m²) and hectares (ha)
- Perimeter in meters (ml or current drawing units)
Note: The table layout adjusts automatically based on what features are enabled in the dialog.


Tips
- Use the DIMSTYLE command to modify arrowheads, text font, and styling for dimensions
- Adjust Text Height and Table Scale to match your sheet size or plotting scale